I am currently involved in a project that measures vehicle movement and present this information to stakeholders. Goal of the project is to create a reference period, then start roadwork and finally measure if the roadwork leads to better traffic flows.
One of the techniques we use is induction loops.
Induction loops
Loops are positioned at strategic positions a coupe of kilometers around the roadwork site. Induction loops generate absolute values about passing traffic, but cannot tell us where traffic is going except when on a road without exits. All the strategic points generate information about in- and outgoing traffic.
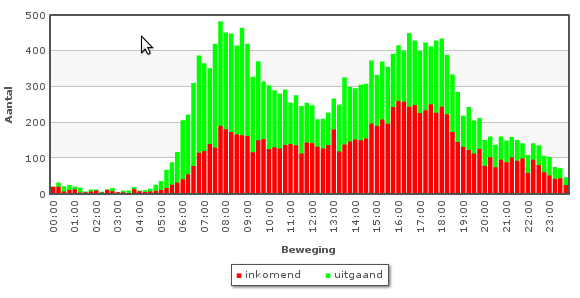
The induction loop data gives insight on the traffic density. It shows clearly that traffic is more dense during business-hours and if you look closely, you can conclude for this particular location that in the morning most traffic leaves the area while in the afternoon, more incoming traffic is shown. In our project, we placed induction loops at 5 locations.
Bluetooth sightings
Near the induction loops bluetooth sensors are placed. These sensors simply register when a “device” enters the proximity and at regular intervals, checks if a device is still in the proximity. The bluetooth sensors give us information about the signal-strength and generate a “privacy-safe” hashed id. This id is used to check the presence of devices at other sensors, I will explain this later on.
After eliminating the time a device stays in the proximity of the sensor, we can generate a graph of all unique devices spotted within a time interval.
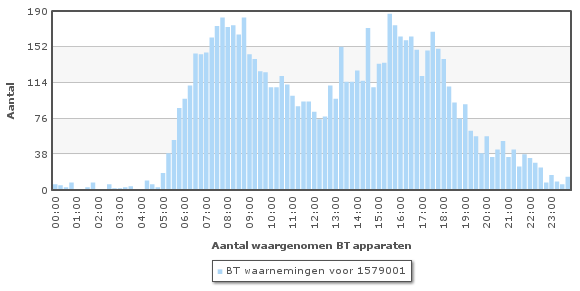
It is already possible to see that the number of bluetooth sightings in a given interval is less then 50% of the number of vehicles passing the induction loops. Given a single location, it is also impossible to determine whether the devices are in a vehicle, on a pedestrian or for instance on 25 people traveling by bus. Devices that are inside buildings within the proximity are also sighted. Somehow we need a rule to eliminate errors. The first rule we apply on the bluetooth data itself is that we eliminate sightings with signal-strengths below a certain threshold.
Doing the math
With the huge database of interval-based sightings and passages, we then do some smart calculations. First of all, we use the bluetooth unique id’s to find out if, where and when devices enter or leave our area of interest, we call these “routes”. The results are then matched against the rule that the time-interval between the sighting of a device at one point and the next needs to be within a “acceptable traveltime for the given route” threshold. This results in a graph displaying “valid routes” and “traveltime” presented against the average traveltime for the given physical route.
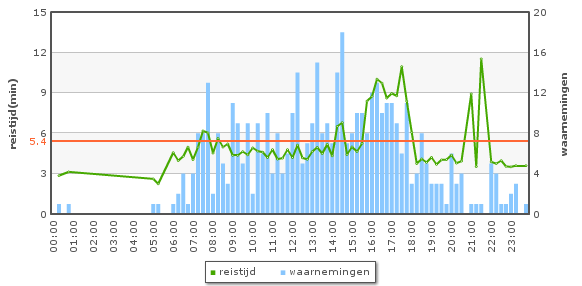
This eventually gives us a model to work with; containing valid routes that can then percentually be matched against in- and outgoing traffic detected by induction loops.
To cut a long story short
All this data, travel-time, loop measurement and bluetooth sightings result in a cumulative graph presenting the “total time spent” by all vehicles in our area of interest.
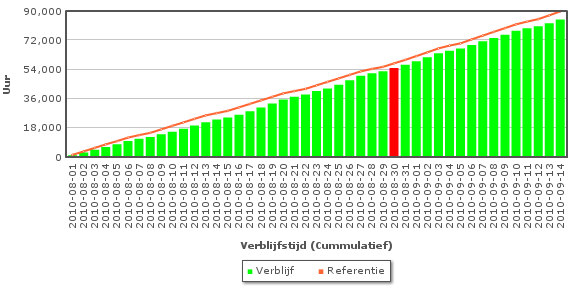
Currently the project is in the phase of building the reference. The roadwork contractor will eventually have to give an indication about the “total time spent” during the works. This will then be matched against the reference. Once the roadwork phase starts, I will come back with a new post on the final results of the project and maybe even come to some conclusion about usability and reliability of the techniques.