A couple of years ago, I was asked to help making a geodataset available in Google Earth.
The data
I recieved a geodataset of Aruba. This dataset was in MapInfo file format and in a projection I could not in any way reproduce. The funny thing was that the authorities providing me with the data didn’t have a clue about how to reproject the data either. The data wasn’t real GIS data, but was derived from Autocad drawings, resulting in linework without topology, with unclosed polygons and poluted by invalid geometries.
Projection
I decided to post a question to the proj mailing list on april 4, 2007. Shortly after that I recieved a response from Clifford J. Mugnier, C.P., C.M.S. National Director of the Photogrammetric Applications Division at ASPRS. It turned out the ASPRS had done a lot of surveying throughout the years to “recover” projections that are local and often not commonly used and often not documented. The ASPRS has a large collection of projections in the Grids and Datums section on their website. Aruba and the Netherlands Antilles had been surveyed and documented in july 2002 and reading through the documentation, I defined these projection parameters:
+proj=tmerc +lat_0=12.51697 +lon_0=-69.994775 +k=0.9996 +x_0=10000 +y_0=15000 +towgs84=0,0,0,0,0,0,0 +units=m +no_defs
I took some small samples of the data and tested conversion with ogr2ogr. In general the reprojection was acceptable, this was hopeful! I decided to create a linux batch to reproject all the data, meanwhile also transforming it to ESRI shapefile so I could easily load it into postgis. When the batch was finished, I transfered the data to one of my servers opened a terminal and started uploading to postgis. When the process was finished, I had over 200 tables.
Merging data
The geodata for Aruba was created in AutoCad and, as you often find with historic geodata, split in sections targeted at creating large scale paper maps.

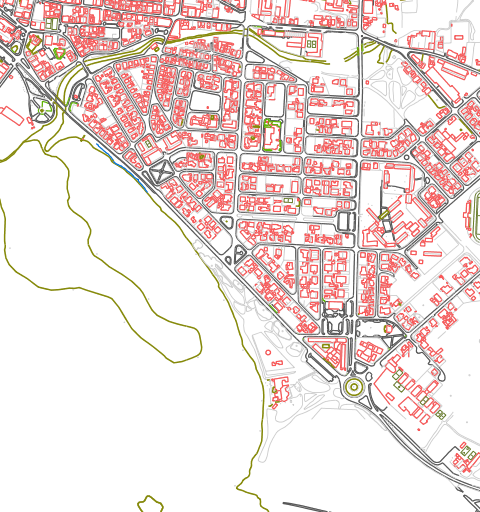
When I ran the first test with geoserver, I didn’t like the fact that the data didn’t connect. It also caused me way to much maintenance to assign styles to all these tables. I also noticed that all the AutoCad symbols where converted to linework too and that not all data was assigned to the correct layers making it nearly impossible to create a good looking online map.
![]()
I decided to merge tables based upon the type of geometry: point, linestring or polygon. And for the symbols, I set up a table containing symbols only. During the merging process, I added the “source” to every object containing the original filename and therefor providing information about the section and the original AutoCad layer. And from this information I extracted the “layer” property so I could later on thematically color/style my map based upon the layer attribute.
Presentation
Once the process of merging data was finished, I set up geoserver to serve the data as WMS. For this I first added a workspace called “aw” then I connected my database to geoserver. Finally I added the 3 remaining, relevant tables as layers.
Then I set up the SLD to color my layers for better readability. In geoserver I set up a Layer Group called “aruba” and tested this through the geoserver layer preview interface. I now have an online map of Aruba!